


Working with data in an educational environment does not have to be complicated. In my three-part series on making a difference with data, I have been describing the five necessary steps to move from an idea to action. In part one of my series, I described how to get started, focusing on the need to clearly define a question or an objective for the data analysis as the critical first step. The second part of my series addressed the critical processes of identifying and gathering the necessary data to support the analysis. In this third and final part of my series, we will delve into the analytics that will turn the data into meaningful insight and illuminate a pathway for action.
The roadmap for the journey from data to insight and action is a simple five-step process. While there are many details behind each of the steps—and different ways to define the steps in the first place—by deliberately following them, anyone can take a more data-driven approach to learning.
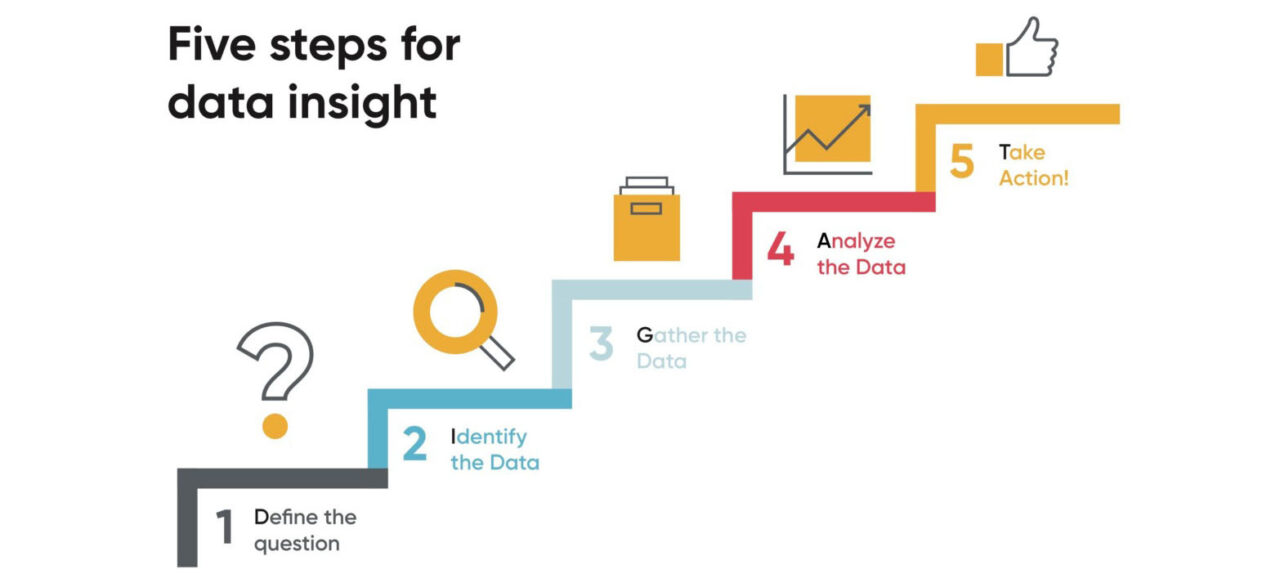
Defining the Question, Finding the Data
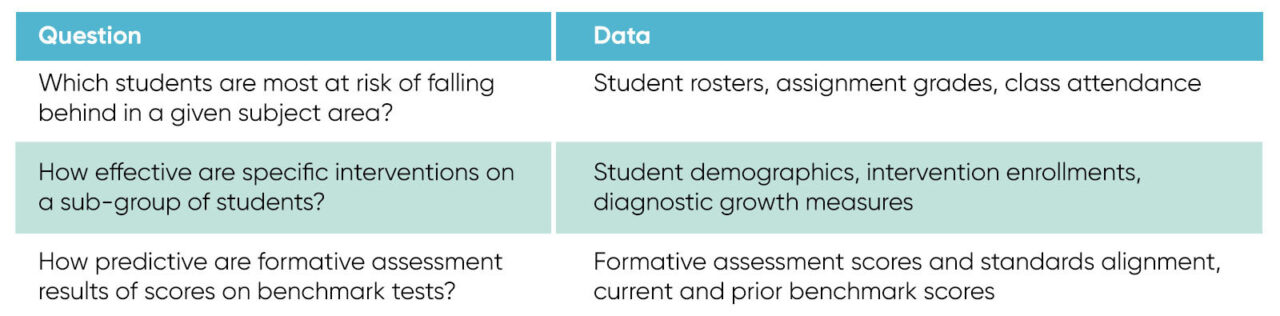
The critical first step in the process—deciding what questions to answer with data—leads directly to the second step: identifying what data is necessary. Some examples of questions that educators may want to answer, and the data necessary to support the process, include:
These first two steps are critical, and surprisingly they are often overlooked. It’s easy to think generally about the questions being asked, and it is also easy to assume that the data is available and ready for analysis. In reality, it can be really difficult to create a solid hypothesis that will drive a meaningful analytics process. And even when the objective is well understood, identifying the actual data necessary—where it exists, and how to access it—can be problematic. Determining the data that is necessary is also only half of the work required; the source of the data also has to be identified.
In an educational system, data lives in many different places, such as the student information system (SIS), the learning management system (LMS), third-party learning platforms, and many, many others. It may also be discovered that the necessary data does not exist anywhere, and a process needs to be put in place to collect and/or generate the required data, in which case the analysis has to be put on hold until the data is available.
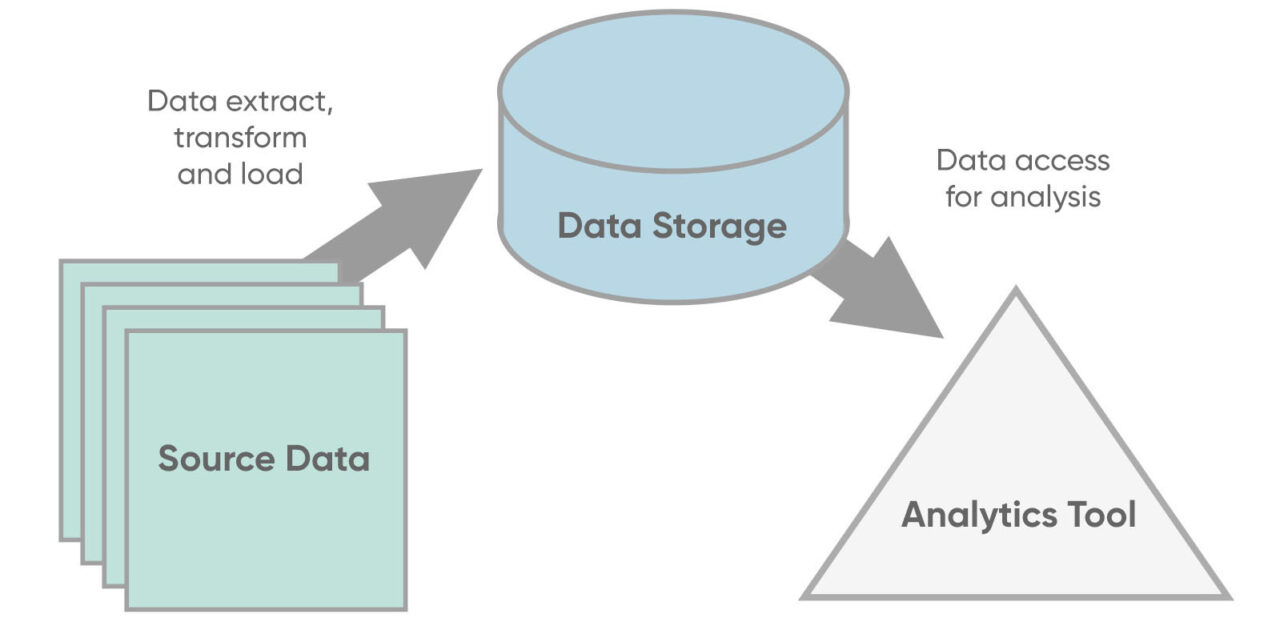
When the data has been identified, three tasks have to be performed—and possibly automated—to gather the data together in a place where it can be analyzed.
- A location has to be identified for where the data will be stored—ideally a secure, durable, and elastic environment where the data can be safely maintained and access can be carefully controlled.
- Processes have to be implemented to capture the data from the source system and place it in the identified location—this is where automation may be necessary. There are also tools to help with this. These tools can be configured to extract the data from the source system, put it into a standard format, and load it into the target environment, on a scheduled or even real-time basis.
- The data has to be effectively organized so it can be accurately accessed and cleaned up for proper analysis. This step in the data insight process—data cleansing—while not necessarily challenging from an analytical or cognitive standpoint, typically requires the greatest amount of human effort and cost.
While data can help users answer questions, its real power exists when advanced analytics are used to help make decisions that enable people to perform better and achieve more. Let’s look at the analysis process.
Analyze and Take Action
Only after the first three steps in the DIG-AT process are completed can a proper analysis be performed. This analysis will turn a collection of data into valuable and useful information that can drive actions that result in better outcomes for teachers and students.
Framework for Information Value
There are different ways to use data to improve the learning process. One way to look at this is to think about the value that data provides. Data alone has minimal value—it is only when it is turned into useful information that it becomes valuable, and this value increases based on the type of analysis performed on it.
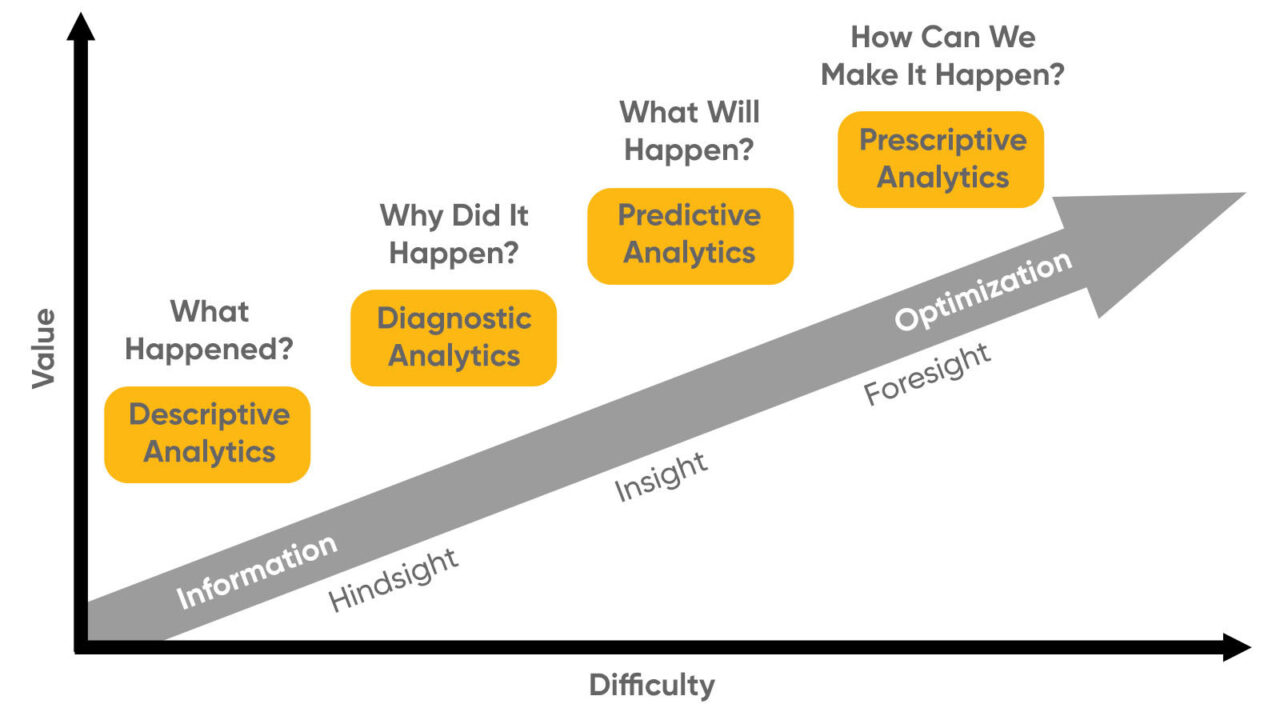
At its most basic level, data can be used to describe something that is currently happening or has already happened. This descriptive data can then be further analyzed to attempt to understand why something happened. Additional analysis, typically through formal research studies, can then be applied to predict—with varying degrees of confidence—what will happen in a similar situation, and then to prescribe an action that might influence an outcome. These advanced levels of value occur through iterative applications of analytics, often using multiple data sets and typically requiring human interpretation and manipulation to ensure accurate application. Figure 1 illustrates this framework and value chain, with the table below providing a description and example for each type of analysis.

The vast majority of the data available is used for descriptive and diagnostic analytics because the processes of predicting and prescribing require more advanced analysis that is often not within the capability of individual teachers, schools, and districts. Sophisticated learning companies like HMH are helping teachers with these more advanced functions—allowing them to become more efficient in the classroom by identifying students who need additional support in real time, while supporting those who are ready for enrichment activities or another learning objective.
At the same time, the need for evidence-based strategies as a result of new Every Student Succeeds Act (ESSA) guidelines will require more rigorous analysis in order to meet “moderate” and “strong” evidence classifications, moving beyond correlations to identify prescriptive strategies where specified outcomes can be causally predicted.
Analysis Architecture
There are a number of different tools to support a school district in the learning analytics process. Extending the graphical representation presented in Part 2 of this series, there now needs to be a platform to process the data and conduct the necessary analysis. Many schools already have tools like Tableau and Microsoft Power BI that are sophisticated and capable of advanced analytics and informative visualizations. It’s also possible to do the analysis in Microsoft Excel or Google Sheets, depending on the specific requirements.
It’s critical to have a data governance plan in place before making data available for broad analysis. This involves having a policy, supported by technological controls, about who can access different kinds of student-related data that include PII (personally identifiable information). Some districts extend data access to their community, requiring an even greater effort to ensure that only appropriate data is being shared and that the data—and related analysis—is clean and accurate.
Take Action
Data analysis is only useful when it leads to action. Action can take different forms, depending on the original purpose of the analysis. For example, if the analysis was designed to identify data-driven indicators for students at risk of falling far behind in a subject area, then the action may be to implement a regular reporting structure that identifies the students whose data displays the identified indicators.
It is also possible that once the data analysis has been completed, the hypothesis upon which the analysis was created may be found to be incorrect—no signals in the data that would allow for action to be taken. Having gone through the prior four steps in the process, taking action on the results of the analysis is the payoff for the all the hard work that came before it. But it is critical that the results be analyzed carefully to determine that what is being interpreted from the data is correct. It can be easy to identify correlations in data, for instance, that look compelling but cannot be attributed on a causal basis.
One of the more likely actions that will be presented is the need to return to the beginning and refine the questions that are being asked. It is frequently the case that in attempting to answer one question, many more are identified. This can be confounding, but it is the nature of data analysis. It is very much like an onion; as one layer is peeled back, many more are found.
But following a defined process like DIG-AT will support the multiple iterations of analysis that are often required to take action and make changes that have an impact on student learning outcomes. And this gets to a critical point: The process is not linear, with a defined start and end. The process is circular, and the steps of taking action will almost always lead back to the definition stage, resulting in better questions, better data, better analysis, and more meaningful and impactful actions.


