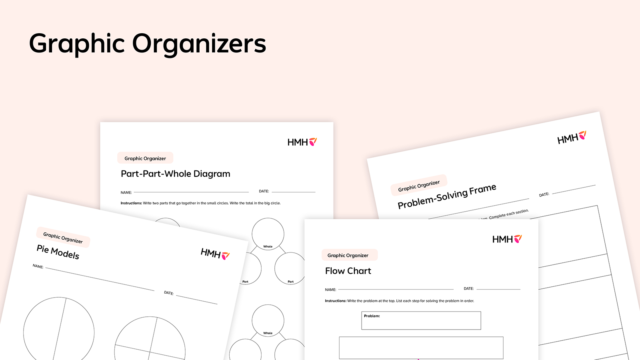
How would you compare, let’s say, a cat and a dog? Would you jot down a list of their similarities and differences? Would you look at photos, videos, or artwork so you can study them? How about using a Venn diagram? Venn diagrams are a universal way to organize ideas and can be found throughout our HMH Into Reading and Into Literature programs. You’re more than likely familiar with this graphic organizer that’s used to compare ideas. This blog will discuss how students can use our free Venn diagram template while brainstorming and planning for essays.
Printable Blank Venn Diagram Template
Download our blank Venn diagram template to use in your classroom:

What Is a Venn Diagram?
First introduced by English mathematician and philosopher John Venn in 1880, a Venn diagram is a tool used to note similarities and differences between ideas. This graphic organizer is a visual way to recognize relationships between subjects. A Venn diagram consists of at least two overlapping circles, with each circle displaying information associated with one subject. The overlapping section of the graphic organizer contains characteristics shared by all subjects.
Venn diagrams are used across grade levels and disciplines. For example, high school students might use a Venn diagram to compare and contrast a complex topic, such as pyramids from various cultures. Younger students might use this graphic organizer to recognize relationships between simple subjects, like triangles versus squares. Venn diagrams remain useful long after school ends! You might use one to compare formative vs. summative assessment, for example.
How to Use a Venn Diagram
We’ve reached the fun part of this lesson—using Venn diagrams! There are plenty of ways students can create Venn diagrams. They can draw at least two overlapping circles on paper. Tech-savvy kids can design a digital Venn diagram instead. You or your students can create one large enough for everyone to see. Students can also use an empty Venn diagram template with two circles.
Once you’ve set up the task, students can use their Venn diagram graphic organizer to help them compare and contrast their subjects. Let’s walk through an example:
Step 1: Choose two or more topics. We’ll keep it familiar and compare our furry friends—cats and dogs.
Step 2: Students should remember that each circle represents one subject and that the overlapping part in the middle represents similarities shared by every subject. Therefore, students should list traits associated with a subject in the respective circle. For example, in the “Dogs” circle, students could list traits associated with dogs but not cats, such as:
- Bark to communicate
- Need to be taken on walks
- Commonly depicted with bones
Step 3: After listing traits per topic, students can fill out the overlapping section. What do cats and dogs have in common?
- Well, for one, they’re both mammals.
- They’re both popular pets with plenty of videos on the internet.
Step 4: At this point, your students should have a detailed Venn diagram consisting of the similarities and differences between their two subjects. They should then be able to see the relationships between their topics.
Step 5: Older students can take this process further by writing a compare and contrast essay:
- Using their notes from their Venn diagrams, students can structure their body paragraphs, for example, using the block method of organizing—discussing one subject in full before moving on to the second subject. The first body paragraph focuses on Subject A, and the second focuses on Subject B.
- The essay’s introduction should include a thesis statement that states the two subjects and a hook, such as a question or a quote. The conclusion paragraph should summarize key points and restate the main idea.
- After planning their essays, students can write their drafts consisting of an introduction, body paragraphs, and a conclusion. Afterward, they can revise, edit, and share the final version of their drafts.
Ideas for Venn Diagrams
Try these topics as ways to incorporate Venn diagrams into your lessons:
ELA
- Two characters from a novel
- Simile versus metaphor
- A movie adaptation of a book to the source
Math
- Even numbers versus multiples of 5
- Triangles versus squares
- Mean versus median
Science
- Bodies of water (for example, lakes versus oceans)
- Two or more climates
- Two or more planets
Social Studies
- Lives of children from another decade versus lives of children living today
- Life in the urban, suburban, or rural environments
- Chinese New Year versus New Year’s celebrations in the United States
***
For more free graphic organizer resources, check out these blogs:
Be the first to read the latest from Shaped.


