


At a glance
- Program: Into Math® Version 2
- Subject: Math
- Report Type: Efficacy Study, Study Conducted by Third Party
- Grade Level: Elementary
- Region: Northeast
- Implementation Model: Core Instruction
This study included a total of three New York schools that were existing users of Into Math® during the 2023–24 school year. Schools/districts that had already purchased the program before the study were recruited.
To assess the use of Into Math as the core mathematics curriculum for Grades K–6, teachers submitted bimonthly implementation logs. They completed two surveys, one at mid-year and another at the end of the year. Data collected through implementation logs included (1) the number of lessons completed and their completion percentage and (2) the components and resources used. The end-of-year teacher survey captured overall math practices, usage, and feedback regarding Into Math.
Into Math is an innovative mathematics program for Grades K–8 that focuses on meeting the needs of the whole child and strives to instill in students a positive attitude toward math. Into Math lessons follow a structured design using predictable mathematical language routines, scaffolded questioning prompts for teachers, and learning progressions, which guide students from the development of deep conceptual understandings that connect to concepts, skills, and procedures so they can apply the learning to unique situations fluently. The program offers a range of resources for teachers, allowing them to select the most effective tools for their classroom. Available in both print and digital formats, Into Math provides flexibility to meet diverse instructional and learning needs.
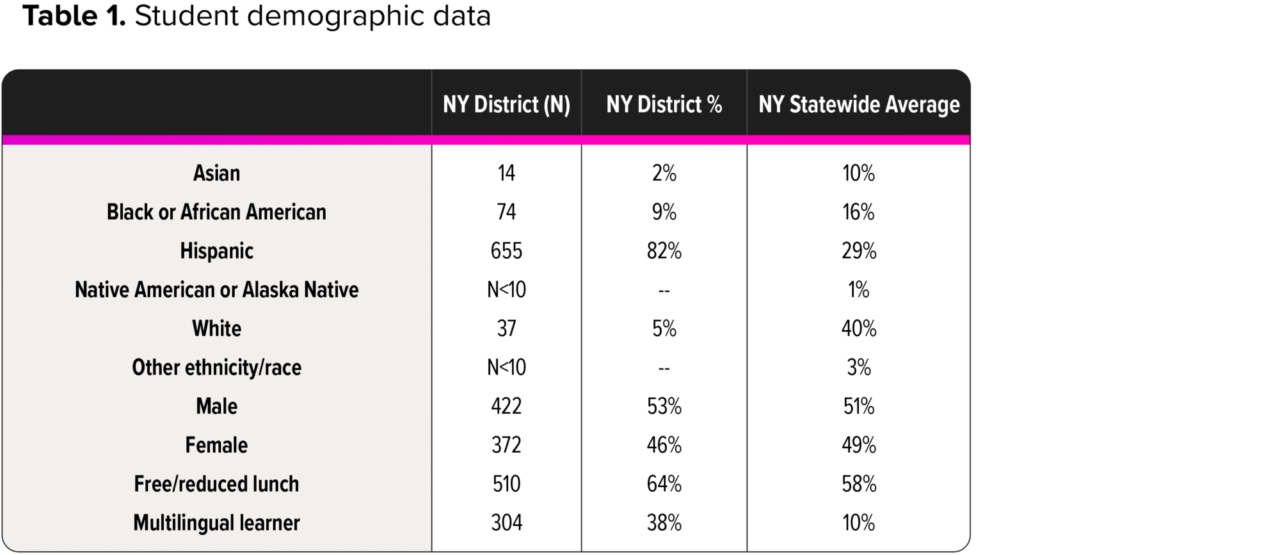
The study included three schools, 51 teachers, and approximately 1,036 Grade K–6 students.
The student population was predominantly Hispanic (82%), with smaller representations of Black or African American (9%) and white students (5%). The proportion of students qualified for free/reduced-price lunch (64%) and classified as multilingual learners (38%) was higher than the state averages of 58% and 10%, respectively. Male students comprised 53% of the sample, and female students accounted for 46%. Demographic data for the district are shown in Table 1.
Math Growth Measure
The Math Growth Measure is a research-based benchmark assessment that provides educators with an overall insight into how their students are performing for their grade level. It is a computer-adaptive test (CAT) that provides data on students’ math performance based on grade-level expectations and growth over time.
CAT utilizes a research-based scaled score (e.g., the Quantile® Framework®) and three performance levels (below level, on-level, and above level). It can be administered in a group setting for approximately 30 minutes up to three times per year.
All students in the district completed the assessment at the beginning of the school year to obtain baseline data, again in February, and one final time at the end of the school year to measure overall growth.
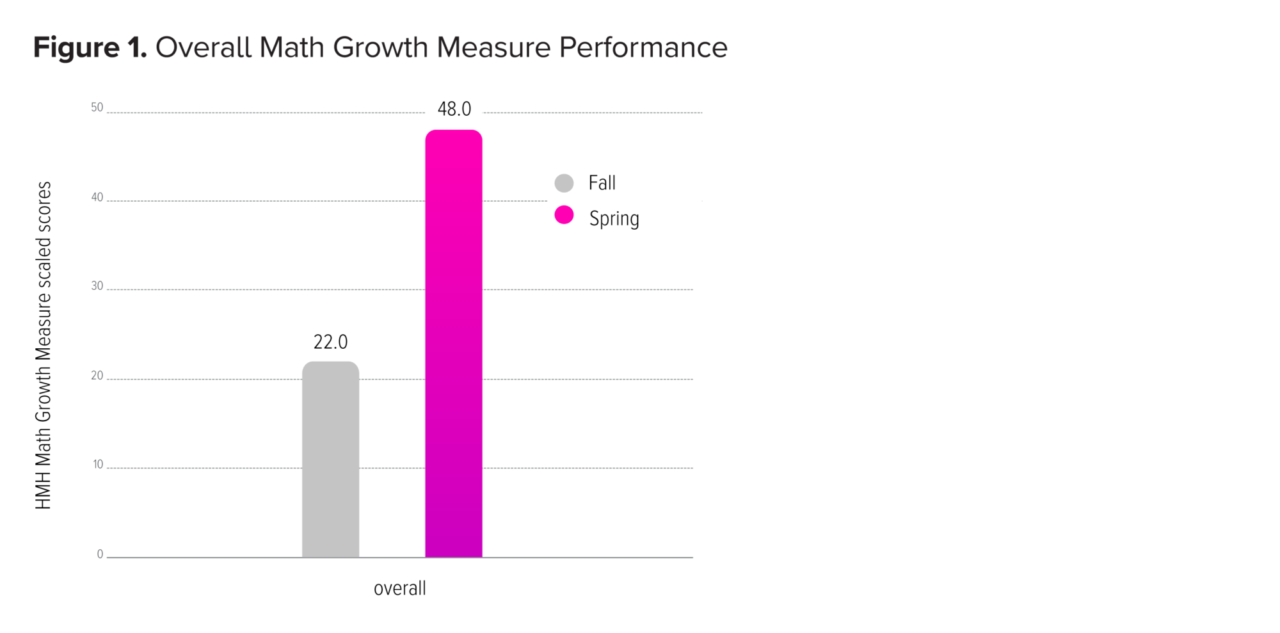
Student mathematics learning gains were analyzed using Math Growth Measure scale scores from the fall (beginning-of-the-year (BOY)) and the spring (end-of-year (EOY)) assessments. A paired sample test revealed overall significant growth with a 26-point increase from BOY to EOY, p < .05.
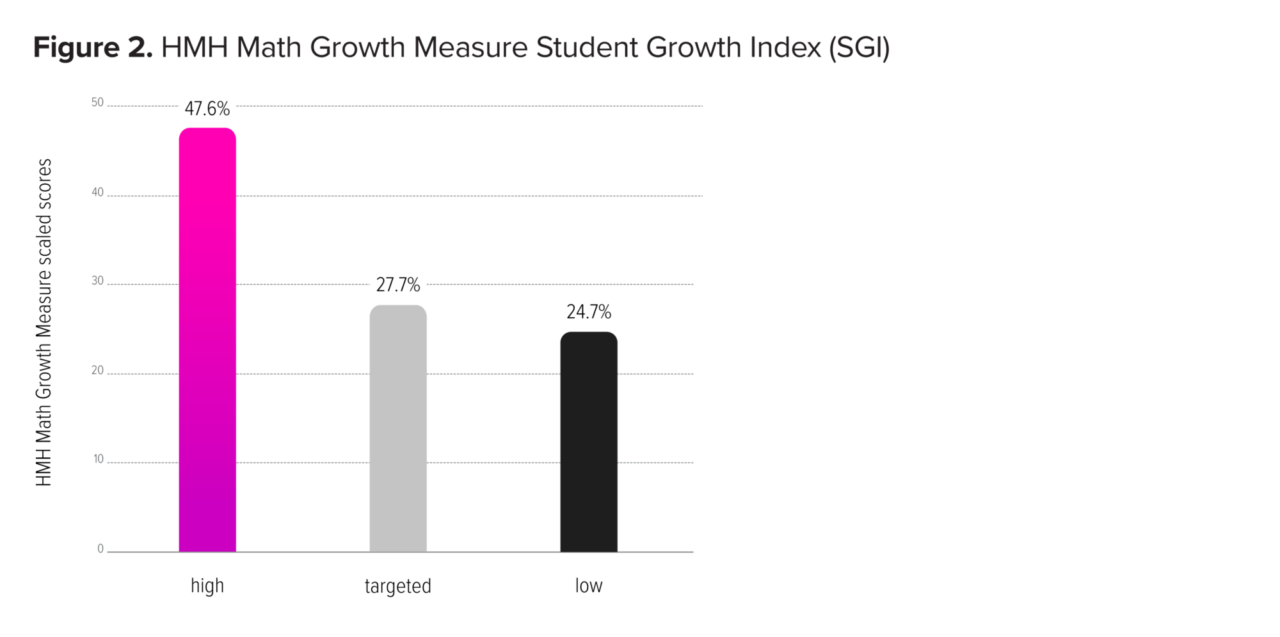
The Student Growth Index (SGI) measures a student's academic progress from fall to spring, with a target of 100. SGI values range from 50 to 150, with the categories of Low (below 95) representing students who may need extra support, Targeted (95-105) representing students on target for growth, and High (above 105) representing students who demonstrate higher than typical growth. As shown, the majority of students (75.3%) met or exceeded their growth targets during the study period.
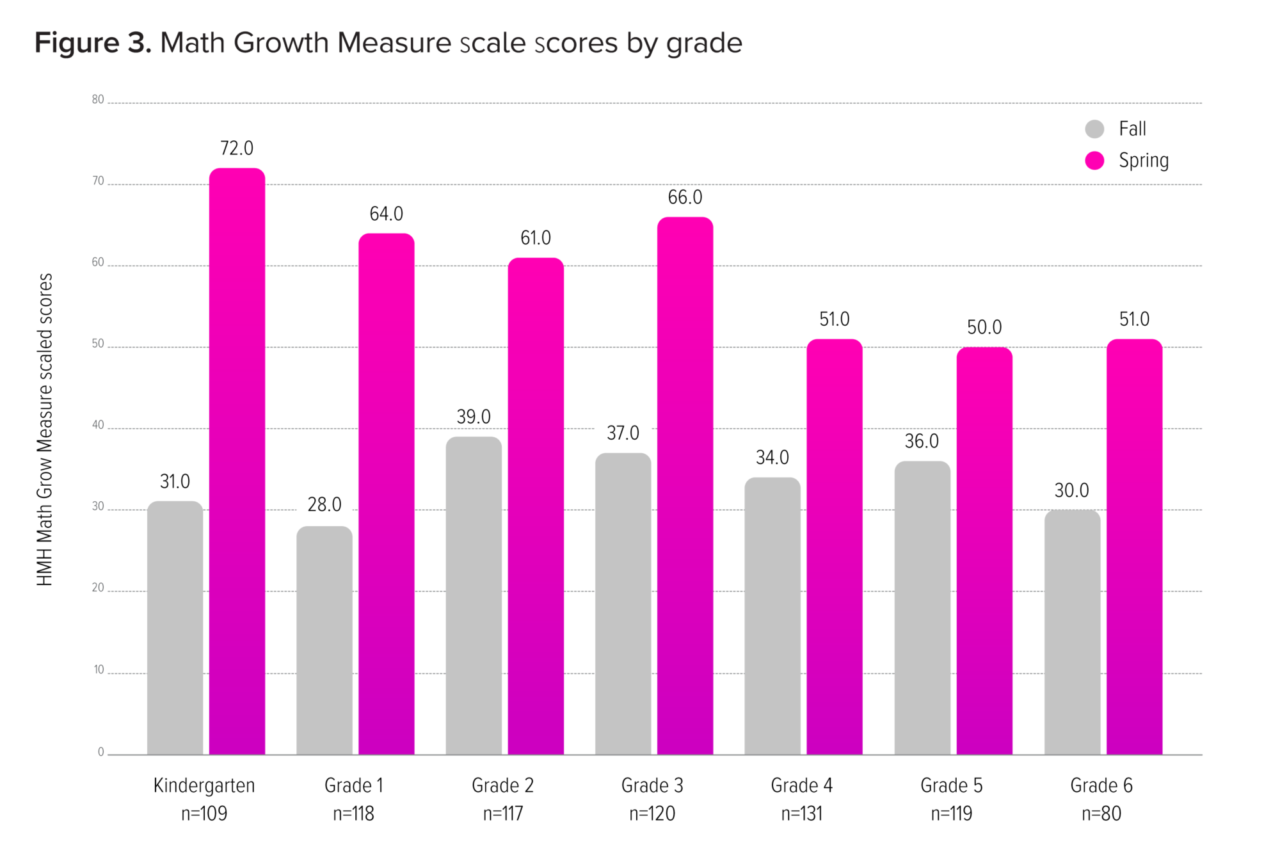
Analysis by grade level showed significant differences in scale scores from BOY to EOY among all grade levels (K–6) tested, p < .05. The largest gains were observed for Kindergarteners and first-grade students, see Figure 3.
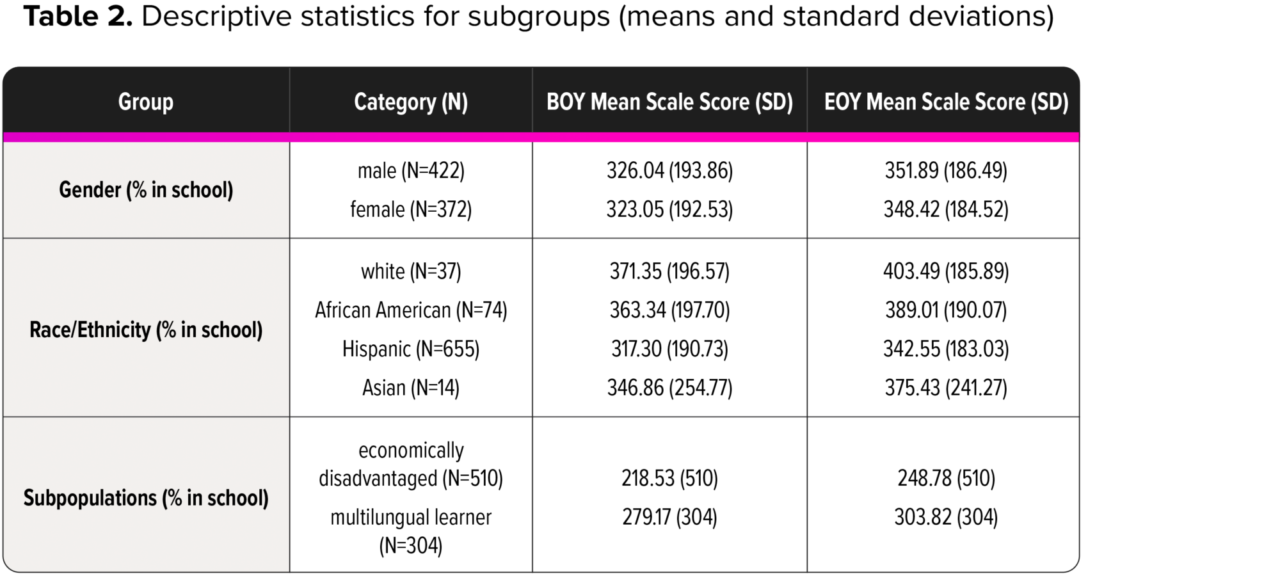
Students in all subpopulations, including by gender, racial/ethnic groups, students receiving free/reduced lunch, and multilingual learners, demonstrated significant growth, p < .05, in math skills, further highlighting the consistency of results among student subgroups (see Table 2).
Findings from the Into Math study show clear evidence of student learning as demonstrated by significant math gains over the school year. Students demonstrated notable improvement on the Math Growth Measure from the beginning to the end of the year, with many starting below grade level and progressing to on- or above-level performance. This growth was consistent across all grade spans and student subgroups, including gender, race/ethnicity, socioeconomic status, and multilingual learners. The study’s consistent findings across diverse student subgroups lend strong support to the positive relationship between the Into Math program and student math gains.