


A total of three districts—selected from HMH’s customer base—participated in the Go Math!® early implementation study. Between 3,000 and 4,100 students are enrolled in these three small districts, which are located in non-urban locales in Kansas, Michigan, and Ohio.
HMH’s Go Math! program is a core curriculum initially launched in the fall of 2010. The program’s latest edition, rebuilt with additional supports, was launched on the HMH Ed® platform in the fall of 2023. This study includes 10 schools in three school districts that implemented Go Math! during the 2023–2024 school year. The study sought to answer the following research questions:
- What does Go Math! implementation look like in practice? What are the most frequently implemented components of Go Math!? To what extent is the program being implemented as intended?
- What are the effects of Go Math! on students’ mathematics achievement?
- How do the effects of Go Math! on students’ mathematics achievement vary by demographic subgroup?
Go Math! is a comprehensive print and digital program that combines whole- and small-group instruction, differentiation, guided and independent practice, and assessment. The Ed platform provides embedded, on-demand professional learning support for teachers as well as access to tools and resources to support instruction. HMH’s Waggle® is integrated with Go Math! to provide adaptive, skills-based practice that is personalized to the student.
Assessment data were available from 132 classrooms across the three districts. Researchers matched the beginning-of-the-year and end-of-the-year assessment scores for 2,606 students (72.7% of all students). Grade-level participation and the number of participating schools varied by district (Table 1).
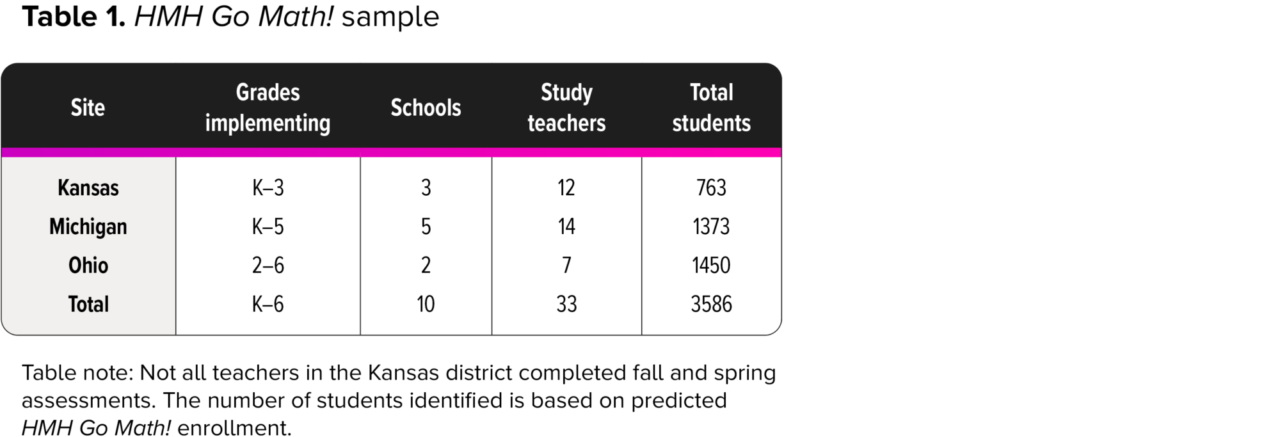
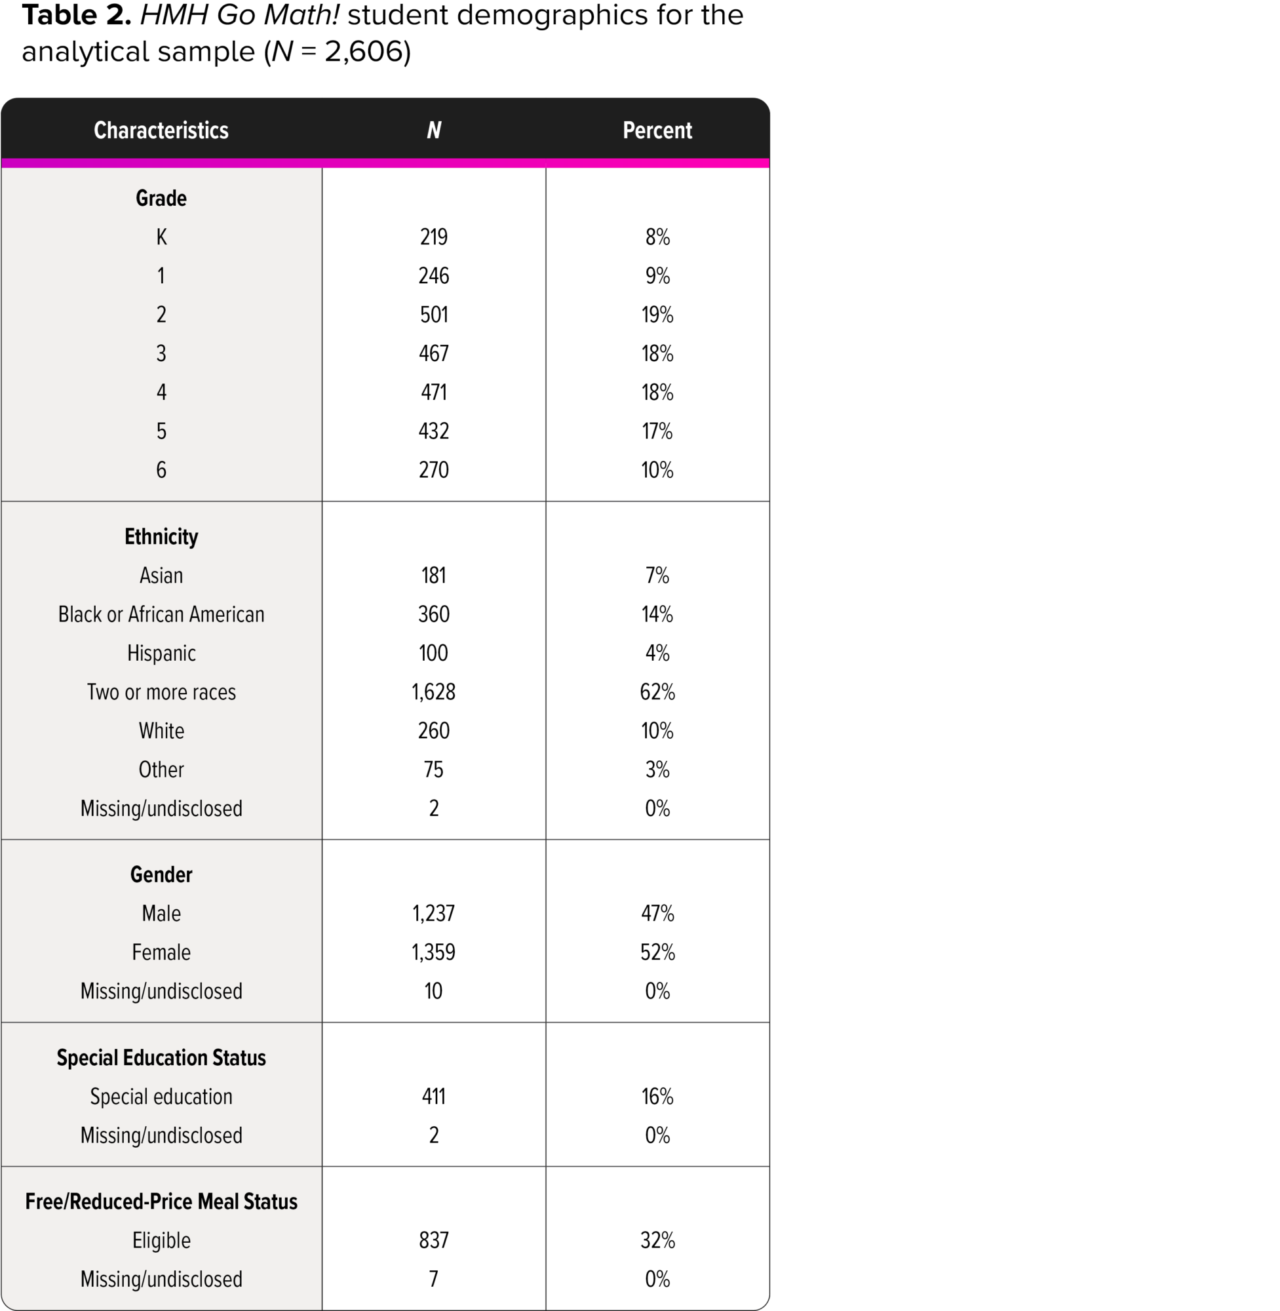
Table 2 presents the demographic characteristics of all 2,606 participating students for whom assessment data are available—the analytic sample for this report.
Districts opted to administer either the NWEA® Measures of Academic Progress (MAP) or HMH’s Math Growth Measure (MGM) as their fall-to-spring assessment.
Math Growth Measure
HMH’s Math Growth Measure is a research-based interim assessment designed to inform instruction by providing information on math performance and grade-level growth expectations. The assessment uses a research-based scaled score ranging from 1 to 99 and five performance levels (far below level, below level, approaching, on level, above level). The Kansas and Michigan districts administered the Math Growth Measure to Go Math! students in the fall and spring of the 2023–2024 school year.
NWEA Measures of Academic Progress (MAP)
The NWEA MAP Growth math assessment is aligned with current education standards and is a norm-referenced measure of student achievement. Results are reported in Rasch units (RIT), an equal-interval vertical scale that ranges from 100 to 350, and percentile ranking. This computer‐adaptive assessment was administered in the fall of 2023 and spring of 2024 to Go Math! students in the Ohio district.
Teacher Survey
Beam Consulting administered an online survey to Go Math! teachers in the fall of 2023 and spring of 2024 to gather information about the teachers’ backgrounds and the types of instructional activities they employed in teaching math. The spring survey also asked about their fidelity of implementation to the intended model.
Teacher Logs
Beam Consulting developed a teacher log for Go Math! teachers to record information about each lesson they completed. The teacher log data are used in the implementation analyses to provide descriptive information about teachers’ implementation of Go Math!, measure their fidelity to the intended model, and provide lesson-specific feedback to HMH.
While implementing Go Math!, teachers reported that, compared to the prior year, they had increased their frequency of use of several instructional practices and learning activities, including explicit vocabulary instruction, math conversations, problem-solving strategies, specific and constructive feedback to students, teacher modeling, solving of nonroutine math problems, application of mathematical concepts to real-world problems, and presentation of problems to the whole class.
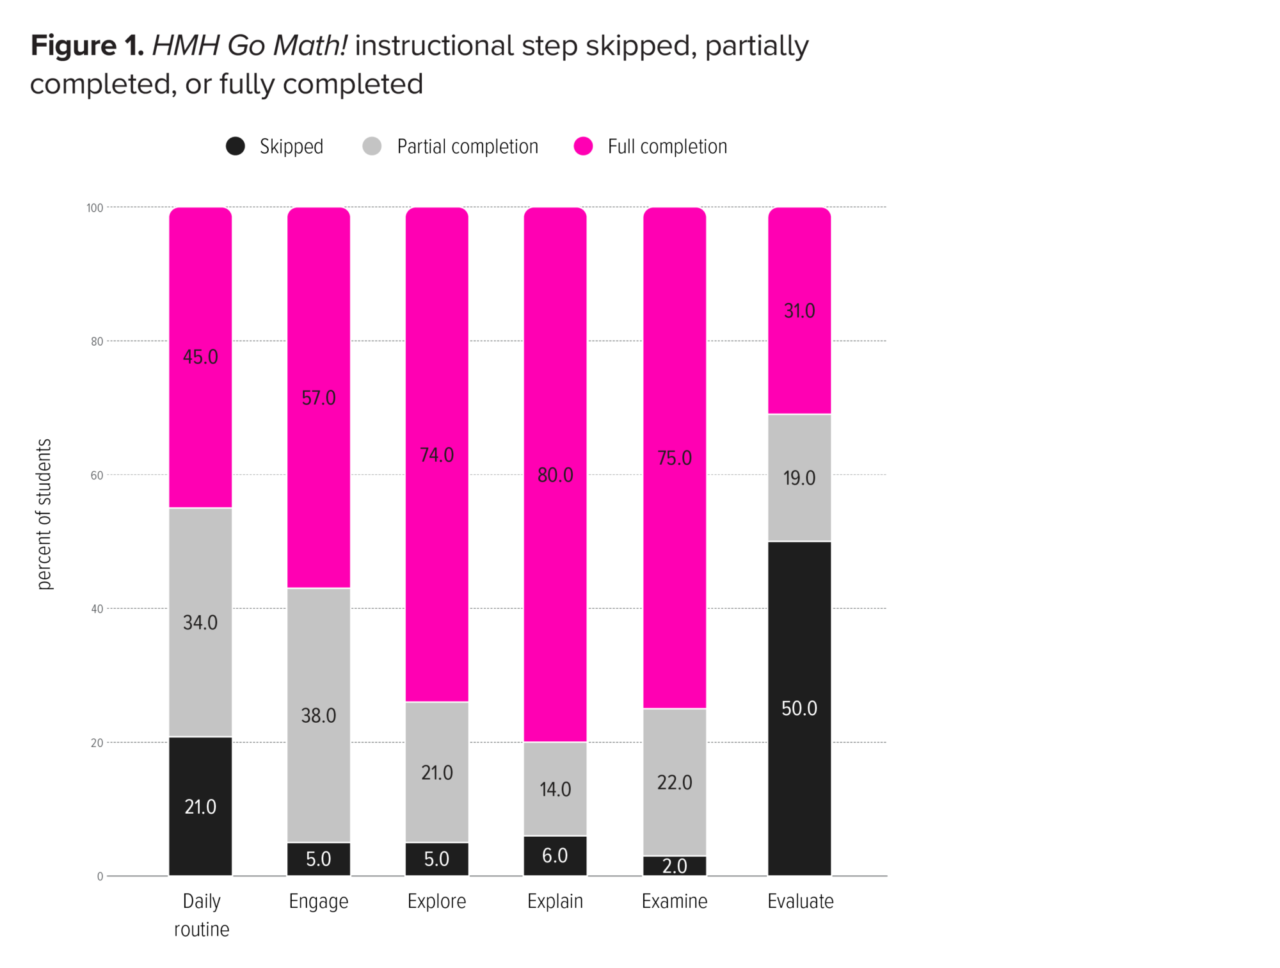
Most study teachers reported teaching the program with at least a moderate level of fidelity. The Go Math! instructional steps that teachers were most likely to teach with fidelity were the Explore, Explain, and Examine steps, whereas the step teachers were most likely to skip was the final Evaluate step (see Figure 1). Primary reasons teachers provided for deviating from the curriculum included pacing—feeling that, in some chapters, the program moved through the content too quickly; challenges with differentiation, often resorting to their own methods rather than fully utilizing the program's resources; and technical issues that prevented them from fully accessing and using the online components of the program effectively.
Teacher fidelity to implementation, as measured by teacher logs, found that teachers in kindergarten through Grade 2 were more likely to adhere to the curriculum (76% average fidelity) than teachers in the upper grades (61% average fidelity).
Paired t-tests were used to evaluate the extent to which students’ course grades and scores on assessments improved after participating in Go Math! by grade level. Math course grades and assessment descriptive data (i.e., means, standard deviations) and paired t-test results are presented in the Appendix in Table 3. (Download the full report to view the Appendix.)
Math Growth Measure
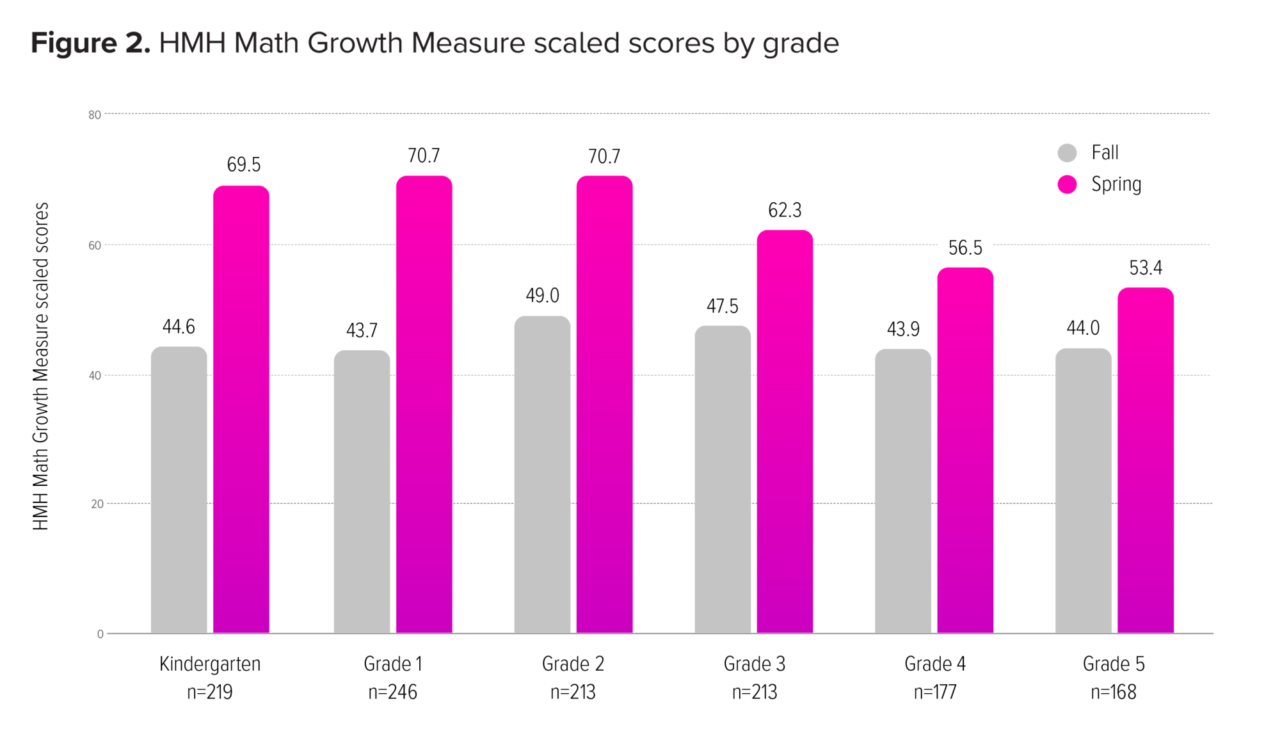
Two districts opted to administer the Math Growth Measure in the fall and spring. A total of 1,236 students from kindergarten through Grade 5 (58% of 2,136 students across both districts—83% of students in one district and 12% of students in the other district) completed both assessments.
Scale score gains and grade-level equivalent gains were significant at all grade levels, with gains ranging from 9.41 (an increase of 0.57 grade-level equivalents) in Grade 5 to 27.30 (an increase of 1.47 grade-level equivalents) in Grade 1 (ps < .05). Overall, greater growth was observed in kindergarten through Grade 2 than in the upper grades (see Figure 2).
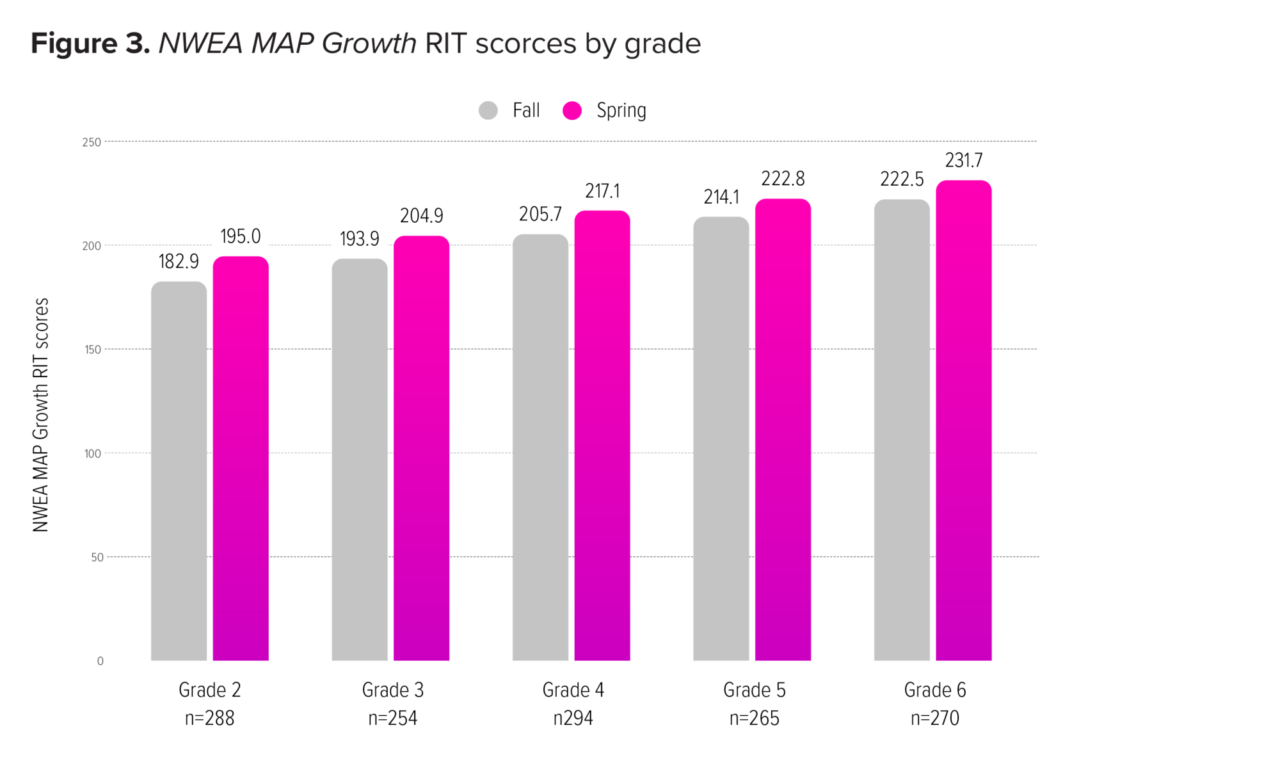
NWEA MAP Growth
Only one of the three districts opted to administer the NWEA MAP Growth assessment, and a total of 1,370 students in Grades 2 through 6 (94% of the district sample) completed both assessments. RIT score gains were significant at all grade levels, with gains ranging from 8.64 in Grade 5 to 12.16 in Grade 2 (ps < .05). RIT score gains across all grade levels were statistically significant, and all effect sizes were large (see Figure 3).
For students participating in Go Math!, both NWEA MAP Growth and Math Growth Measure assessment scores generally favored White students, non-special education students, and economically advantaged students. These trends mimic national trends and are not surprising.
Further analyses examining gains within different demographic subgroups found that, while at some grade levels, some small variation in gains occurred within subgroups, all tested subgroups (i.e., gender, race, special education status, and free and reduced-price meal status) achieved significant and substantial gains (ps < .05) (Download the full report to view Appendix Tables 5 and 6).
This early implementation study of the newly launched Go Math! program sought to measure teacher implementation and program effects across multiple sites and recruited districts that were using the program in their schools.
Teachers varied in their fidelity of implementation, maintaining higher fidelity with some instructional steps over others, but most teachers reported that they implemented the program with either moderate or high fidelity. Primary reasons teachers gave for deviating from the curriculum included pacing issues, differentiation challenges, or technical difficulties. Teachers also provided suggestions for the program and areas where they believed they could benefit from additional professional learning.
Overall, study findings showed that students in districts using Go Math! demonstrated significant gains on both district-administered assessments. While the magnitude of gains varied across grade levels, with lower grades exhibiting greater growth potentially due to greater fidelity of implementation, significant gains were observed in all grade levels. Fall and spring assessment scores generally favored White students, non-special education students, and economically advantaged students; not surprisingly, these trends mimic national trends. While some grade levels exhibited slight variation in gains between subgroups, all tested subgroups (gender, race, special education status, and free and reduced-price meal status) achieved significant and substantial gains.