


At a glance
- Program: Math 180®
- Subjects: Math, Intervention Curriculum
- Report Type: Efficacy Study, Study Conducted by Third Party
- Grade Level: Middle
- Region: Midwest, Southeast, Southwest, West
- District Urbanicity: Suburban
- District Size: Large
- Implementation Model: 40-59 Minutes
The four districts participating in the research study represented distinct regions throughout the United States including the Central, South, Texas, and the Rocky Mountains. The districts varied considerably in size from just over 10,000 to approximately 200,000 students served.
The purpose of this study was to gauge the differential impact of MATH 180 program exposure and progress from various components of the program on student mathematical outcomes. The study attempted to predict the level of student growth in math achievement with the quantity and in some cases quality of student activity in the MATH 180 program while controlling for the students’ prior level of math achievement. The results of this study will increase our understanding of the unique contributions of student exposure and progress by providing a quantifiable manifestation of these elements on student outcomes.
MATH 180 is an intervention program designed to rebuild the foundations necessary for success in algebra. The program consists of two courses, and each course contains nine blocks. This study examines the efficacy of the first of these two courses. In this course, the program covers multiplication, division, fractions, decimals, and integers. The program is a blended learning model with both teacher-led instruction and a self-paced software component. MATH 180 classes tend to be 45–50 minutes long and meet five days a week. Students spend the first five minutes of class time working on and then discussing a Do Now problem. Next, students are divided into two groups. Based on data provided by the software, one group receives approximately 20 minutes of instruction directly from their teacher, while the other group works through instruction at their own pace on the MATH 180 software. After about 20 minutes, the two groups switch. Class size can vary but there’s an attempt to keep class size to 20 students per class.
During the 2014–2015 school year, 54 middle schools from four districts participated in a MATH 180 research study. Teachers who had not taught MATH 180 in the prior year were provided with an initial two-day training session at the beginning of the school year to familiarize themselves with the program and reinforce the importance of adhering to the implementation model. Teachers were also provided an additional day of training in the middle of the school year. This session focused on the interpretation and effective use of student data that was currently being generated by the software and Math Inventory® test scores.
Students were in Grades 6–8 during the 2014–2015 school year. All participants were selected by their school as being in need of supplemental mathematics intervention. Therefore, in addition to MATH 180, students were also enrolled in their regular grade-level core math classes.
The MATH 180 software program records students’ progress and time spent in the program. There are several components within the software, which include the Explore Zone, Learn Zone, Success Zone, and Brain Arcade. These components represent the areas where students explore, practice, and master math concepts. Another component of the software experience is the Student Dashboard. The Dashboard is where the students first enter the program when they log on each day. It allows students to view their progress and provides access to the other software zones. The program is organized into nine instructional blocks where students interact with high-interest concepts and learn to apply math to careers, cultural events, and their lives. Each block contains 3 topics, and each topic contains 2 or 3 lessons. Students complete these lessons along with simulations in the Explore Zone, games in the Brain Arcade, and a game-based assessment at the end of each block in the Success Zone. The software records student activity in addition to time spent on each lesson and in each zone or area of the program.
The Math Inventory is a computer adaptive test (CAT) for levels K–Algebra II. During the 30- to 50-minute assessment, students encounter 25 to 45 questions. The program delivers questions targeted to the student’s current achievement level and bases the delivery of subsequent questions on his or her responses, eventually narrowing down to a final estimate of the student’s level of math achievement. The Math Inventory scores are reported as Quantile® (Q) measures and can be used as a screener to determine whether MATH 180 is the appropriate intervention program for a student. The Math Inventory can also be used to inform instruction and help teachers understand how much students have grown since previous administrations of the test. The Math Inventory can be used separately from MATH 180 but is also included with the program. Students in this study completed at least two Math Inventory assessments, one in the fall and the other in the spring, with an average of 254 days between fall and spring test administrations. Many students also took the assessment in the winter, but those scores were not used in this study.
Growth in math achievement, as defined by the difference in Quantile measure between a student’s fall and spring administrations, was predicted by student exposure and progress with the program. The indicators of student exposure to the program that were used as predictors in the analyses were total time spent in five areas of the program (Dashboard, Explore Zone, Learn Zone, Success Zone, and Brain Arcade). Student progress was measured by the number of topics completed successfully in the software. Topics are considered complete when students finish the requisite material for that section. In addition to recording simple completion, student activity in a topic is scored using a 4-point rubric that takes problem-solving activities into consideration. A score of 3 or 4 (proficient or mastered) indicates the topic has been completed successfully.
The other half of the MATH 180 instructional equation—teacher-facilitated instruction—is not directly recorded in the program’s software. However, an mSkills assessment is usually taken online after each block of teacher-facilitated instruction. As a result, the number of mSkills completed can be used as a proxy for progress in the teacher-facilitated portion of the program. Each mSkills completed represents one block, or three topics, completed by the teacher in the classroom. Since yearly growth can often be influenced by a student’s starting levels of math achievement, the fall Math Inventory scores were also used as an indicator of prior math achievement to control for this effect.
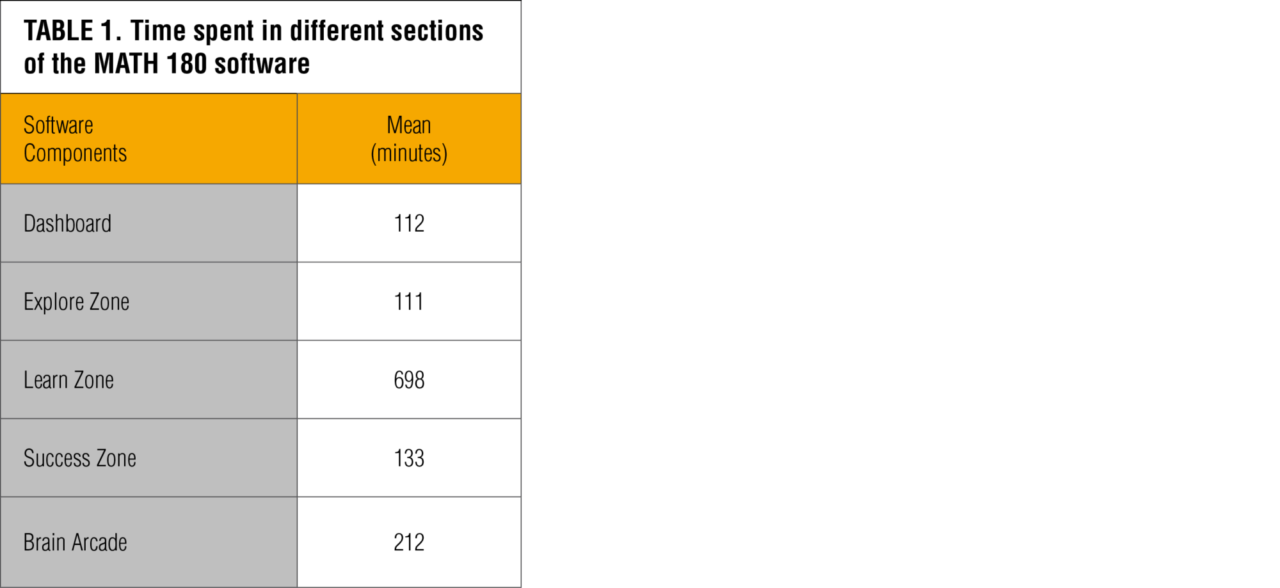
The average Math Inventory scores for students participating in this study were 451Q in the fall and 523Q in the spring, representing an average growth of 72Q. The average total time spent on the software portion of the program was 1,266 minutes, which is a little more than 21 hours. Students spent most of this software time in the Learn Zone (see Table 1). Time spent in the other areas of the software (Dashboard, Explore Zone, Success Zone, and Brain Arcade) were roughly equivalent with the exception of Brain Arcade, which was slightly higher.
Students completed an average of 9.5 topics in the software, and they completed an average of 8.6 topics successfully. This represents a little more than 3 blocks completed and almost 3 blocks completed successfully. Students also completed an average of 3.8 blocks of teacher-facilitated instruction, which was slightly ahead of their self-paced software progress. Student progress tended to vary considerably since topics completed in the software is a self-paced feature of the program. Conversely, the number of mSkills assessments completed (a proxy for teacher-led instructional progress) tended to be much less variable.
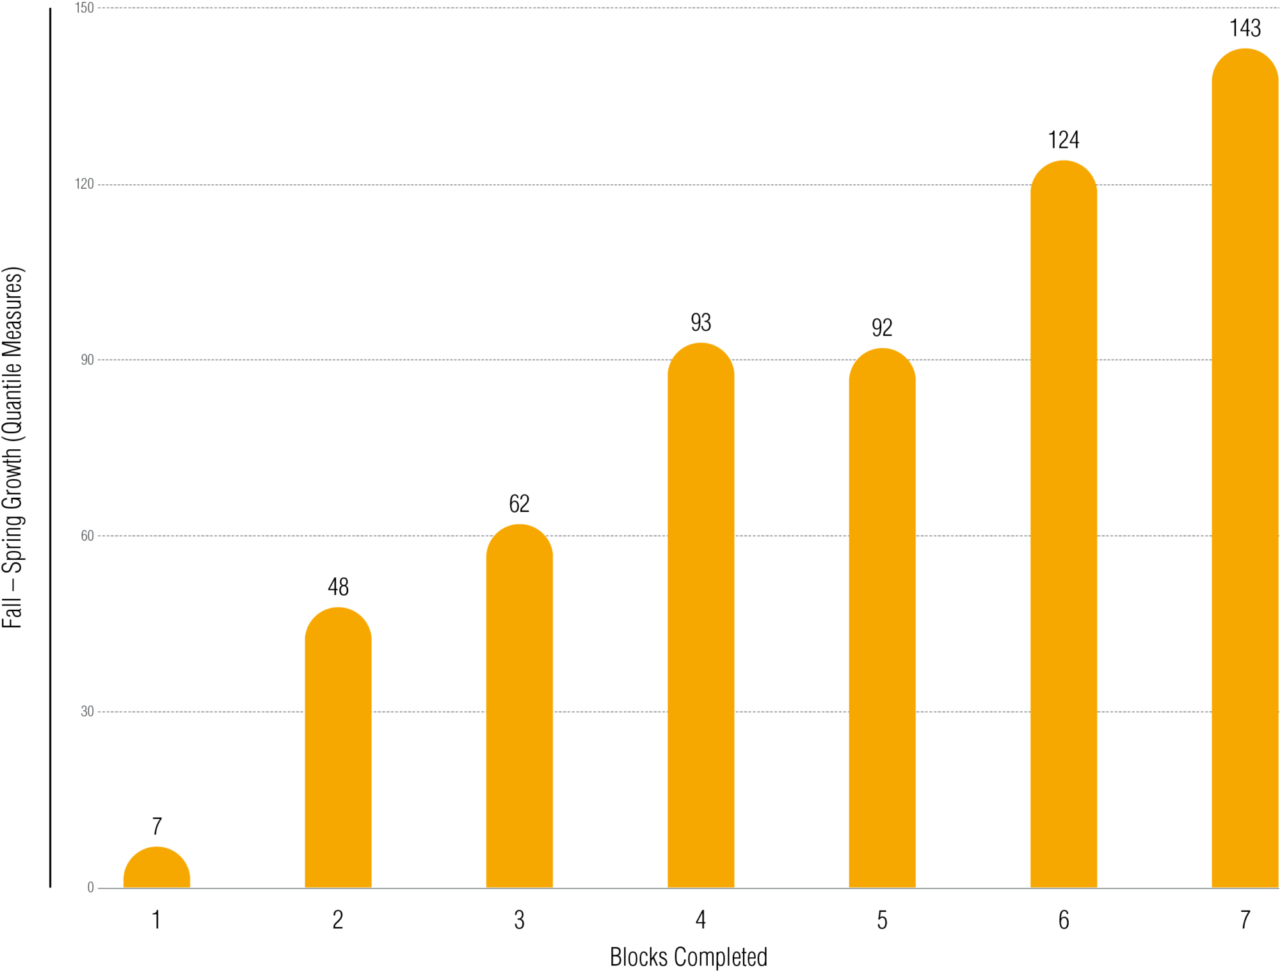
If a program is influencing student learning, there should be some association between the use of that program and student outcomes. As a result, for this study there would be an expectation that progress through the MATH 180 software should accompany increases in student achievement. We see this trend emerge when we look at the average Quantile growth exhibited in MATH 180 students by blocks completed (see Figure 1). The data indicates that students experience greater growth on average as they complete more blocks. Growth is not reported for blocks 8 and 9 due to lack of sample sizes necessary to compute a stable statistic.
These results suggest an association between amount of progress in the program and math achievement outcomes. However, these results only show the relation between completion and student math achievement in isolation, without accounting for the complexity of other factors that may also influence student performance. In an attempt to address at least some aspect of this complexity for predicting growth in math achievement, a multiple regression analysis was performed to examine the individual contributions of program exposure and progress to growth in math achievement. The variables that were used as predictors included prior math achievement (fall Math Inventory score); total time spent (level of exposure) individually on Dashboard, Explore Zone, Learn Zone, Success Zone, and Brain Arcade; number of topics completed successfully (level of progress); and the number of mSkills completed (a proxy for teacher-facilitated instructional progress).
Before the regression models were run, each of the variables were checked to see if they satisfied the statistical assumptions underlying this form of analysis. Checks for normality, multicollinearity, and both univariate and multivariate outliers were performed for each independent variable in the model. The results of these checks revealed some positive levels of skew for Explore Zone, Success Zone, and Brain Arcade time and substantial positive skew for Dashboard time. These variables were transformed using a square root and logarithm function, respectively, in order to satisfy the assumptions of the regression model.
After statistical assumptions surrounding the data were met, a sequential regression analysis was undertaken in two steps. Initially, prior math achievement, as measured by fall Math Inventory scores, was introduced into the model. This was done to control for the effects of this variable on growth in math achievement that was not directly related to the MATH 180 program. The next step in the model added the additional MATH 180 predictors to the regression equation. Therefore, any differences in the model between step 1 and step 2 were treated as an influence of the MATH 180 program components above and beyond that of prior achievement.
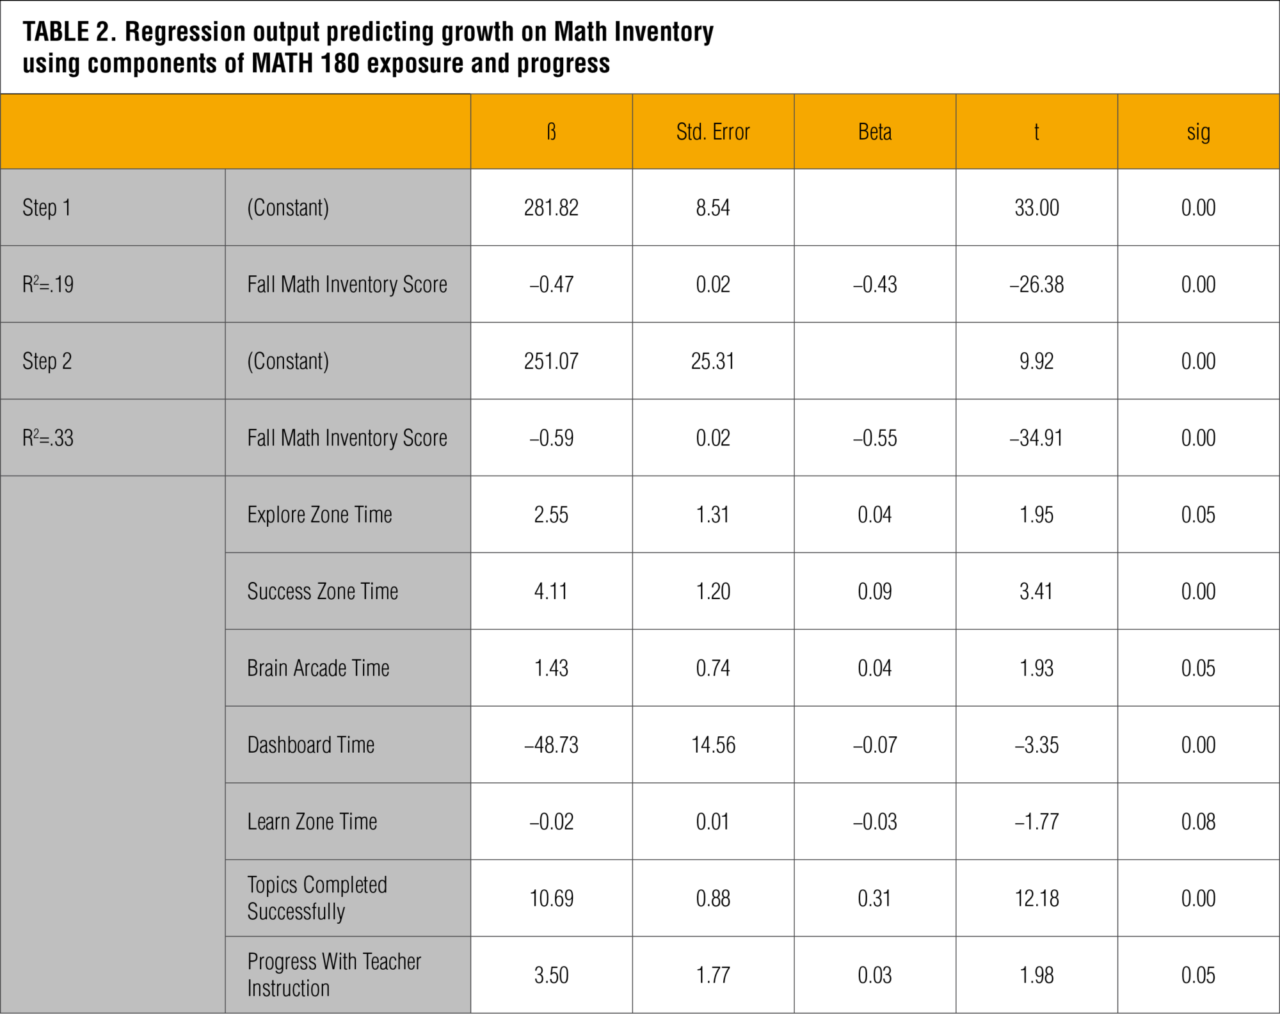
Of initial interest was whether the model tested was statistically significant. The significance test for the first two steps of the model indicated both were significant with F(1,3037) = 686, p < .01 and F(8,3030) = 186, p < .01 for steps 1 and 2, respectively. Also of note was how much of the variance attributed to the dependent measure (growth in math achievement) could be attributed to the predictors. The adjusted R2 provides this information, as it takes into consideration the number of predictors and sample size. The initial regression step with prior knowledge produced an R2 = .19, indicating that 19% of the variance of student math growth was accounted for by this variable (see Table 2). The R2 increased to .33 with the addition of the program elements, resulting in a change in R2 of .14. All of these R2 values including the change in R2 were significant at the p < .01 level of significance.
This indicates that the components of the MATH 180 program significantly contributed to the prediction of growth in math achievement above and beyond that of prior math knowledge.
Another important factor to be considered is the relative importance or role each of the program components has in predicting student outcomes. Table 2 provides a summary of these predictors and their relative contributionfor explaining average yearly Quantile growth in MATH 180 students. Because of the different units of measurement associated with many of the predictor variables, standardized regression coefficients (beta) were initially evaluated because they allow for a direct comparison between the relative contributions of each predictor. Each of these beta weights are displayed in Table 2 with their corresponding level of statistical significance. An inspection of this table indicates that 4 out of 8 predictors significantly contributed to the explanation of growth in student math achievement at the p < .01 level of significance. These predictors were Fall Math Inventory Score (prior math achievement), Success Zone Time, Dashboard Time, and Topics Completed successfully. Time spent in Explore Zone and Brain Arcade and the progress made by the teacher were significant predictors at the p < .05 level of significance. A closer inspection of the beta weights associated with these variables indicates a very modest contribution to growth in achievement with the exception of prior achievement (beta = -.55) and total number of topics completed successfully (beta = .31). These two variables clearly stand out as the strongest predictors of math growth. The negative value associated with prior achievement indicates that growth decreases as student starting scores increase. This finding is not surprising and has been seen in other depictions of student growth.
As stated earlier, the beta value provides a standardized view of a variable's contribution to the prediction of growth in math achievement. The unstandardized weights, shown in the Table 2 column labeled “ß,” provide the unique contribution of the variables using their original units of measurement. Because of the variations in measurement units (i.e., time spent, topics completed successfully) and transformations on some of these variables, unstandardized statistics can be difficult to interpret and compare. However, the topics completed successfully interpretation is fairly straightforward. The ß value of 10.69 indicates that for every unit increase in this independent variable (topics completed successfully), we can expect to see an average increase of 10.69 in the dependent measure (growth in math achievement). Therefore, according to the model, for every topic completed successfully in the MATH 180 software, we can expect to see an average increase of 10.69 Quantile measures on the Math Inventory.
The results of this study indicate that progress in the MATH 180 program (and, to a lesser extent, exposure) can lead to positive math achievement outcomes. The study examined the influence of time spent in the various components of the MATH 180 program software, progress in teacher-facilitated instruction, and successful completion of software topics. The results indicated that the activities in MATH 180 were significant predictors of growth in student achievement above and beyond what you could predict from the student’s prior math score alone. Although exposure to the program, measured by time spent in the various zones, were all meaningful predictors, actual successful completion of topics was the single greatest programmatic factor. Successful completion of topics is different than time on task because it requires specific input and activity by the students. It should be noted that the number of topics completed (regardless of success) was used in earlier models and was also predictive of eventual growth.
However, successful completion was even more predictive and therefore retained in the final model. The relative importance of progress in the program does not imply that time spent in some of the zones does not have importance. Students still need to put in the time in order to successfully complete the topics, so time spent contributes to that success.
However, these findings do indicate that it is not enough to put in the time alone and expect results from the MATH 180 program. There must be a certain level of active involvement in the form of completed topics to maximize that time spent. Surprisingly, the zone with the greatest amount of time spent (Learn Zone) was one of the least predictive of growth in math achievement. This may be due to the fact that students are still gaining an understanding of the material in this zone and do not fully begin to demonstrate their newly acquired knowledge until they reach the Success Zone. The negative beta associated with Learn Zone time may also be an indicator that it is possible to spend too much time in a zone when it is at the expense of other activities that will move the student forward. In other words, there may be a point of diminishing returns regarding time spent in the Learn Zone for some students. The significant and negative beta weight associated with Dashboard time illustrates this same phenomenon.
The results outlined in this study point to the importance of student progress in the MATH 180 program, indicating that time spent in the program does not guarantee success. The results outlined in this study represent an initial step in recognizing the complexity of a student's learning environment by accounting for time spent and active use of the MATH 180 program. However, there are many other factors that can contribute to student learning in a classroom setting. Teachers are integral components to the MATH 180 program, and they bring with them content knowledge, pedagogy, and their own beliefs about how children learn. Students are equally complex and dynamic components to this equation. In addition to their prior knowledge, students bring to the program their level of growth mindset, perceptions of failure, and attitudes toward school and peers. The inclusion of these factors will further our understanding of how students learn and demonstrate their knowledge. Future research can begin to account for this greater complexity by introducing teacher factors and other student attributes, such as their affective behaviors.